Top 10 Car Models With the Highest Speeding Ticket Rates
Speeding tickets can signal risky driving behavior to insurance companies, and insurers typically charge higher premiums to drivers with violations on their records. The national average cost of full-coverage car insurance after a speeding ticket is $3,039 per year, an increase of 27%, according to our rate data at Compare.com.
Drivers of the 10 most ticketed vehicles are also 68% more likely than the average driver to have an accident on their record, 7.9% compared with 4.7% nationally.
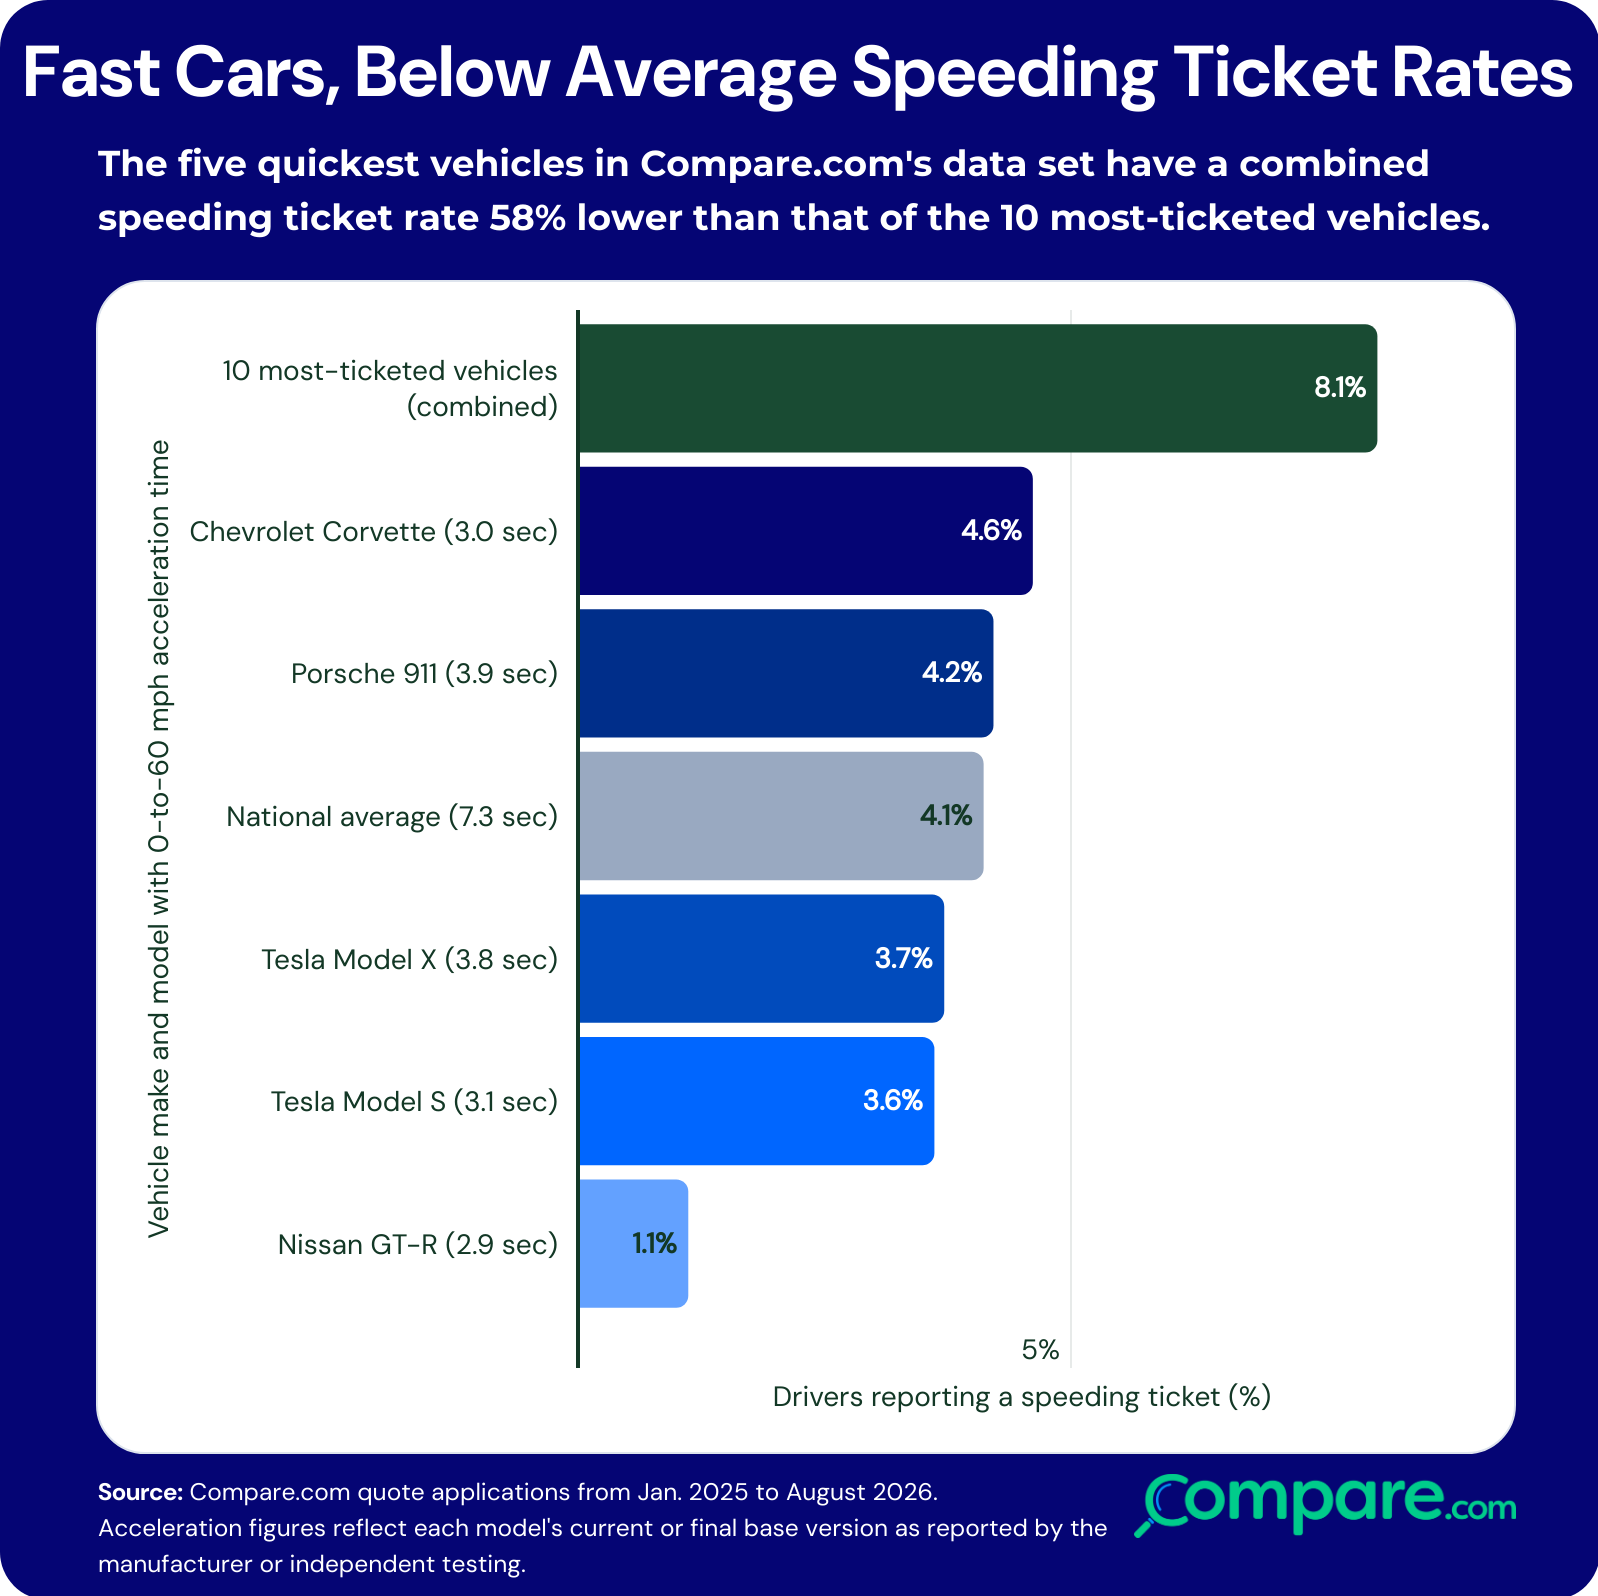
Drivers themselves are the main factor when it comes to speeding, but certain vehicle characteristics may attract drivers who want to make the most of a car’s performance. Seven of the 10 vehicles on this list use turbocharged engines, a feature that can appeal to drivers who prioritize a responsive, performance-focused driving experience.
Faster depreciation can also make luxury and performance vehicles more affordable to a broader group of used-car buyers.
Six of the 10 vehicles on our list lose value faster than the average vehicle, which depreciates 41.8% over five years. The Jaguar XF loses 59.5% of its value over five years, while the Alfa Romeo Giulia loses 52.2%, the two highest depreciation rates out of the list.
 1. BMW 4 Series
Speeding ticket likelihood: 94 in 1,000 drivers
Average annual premium post-speeding ticket: $4,309 (+26%)
Base horsepower: 255
MSRP: $50,700
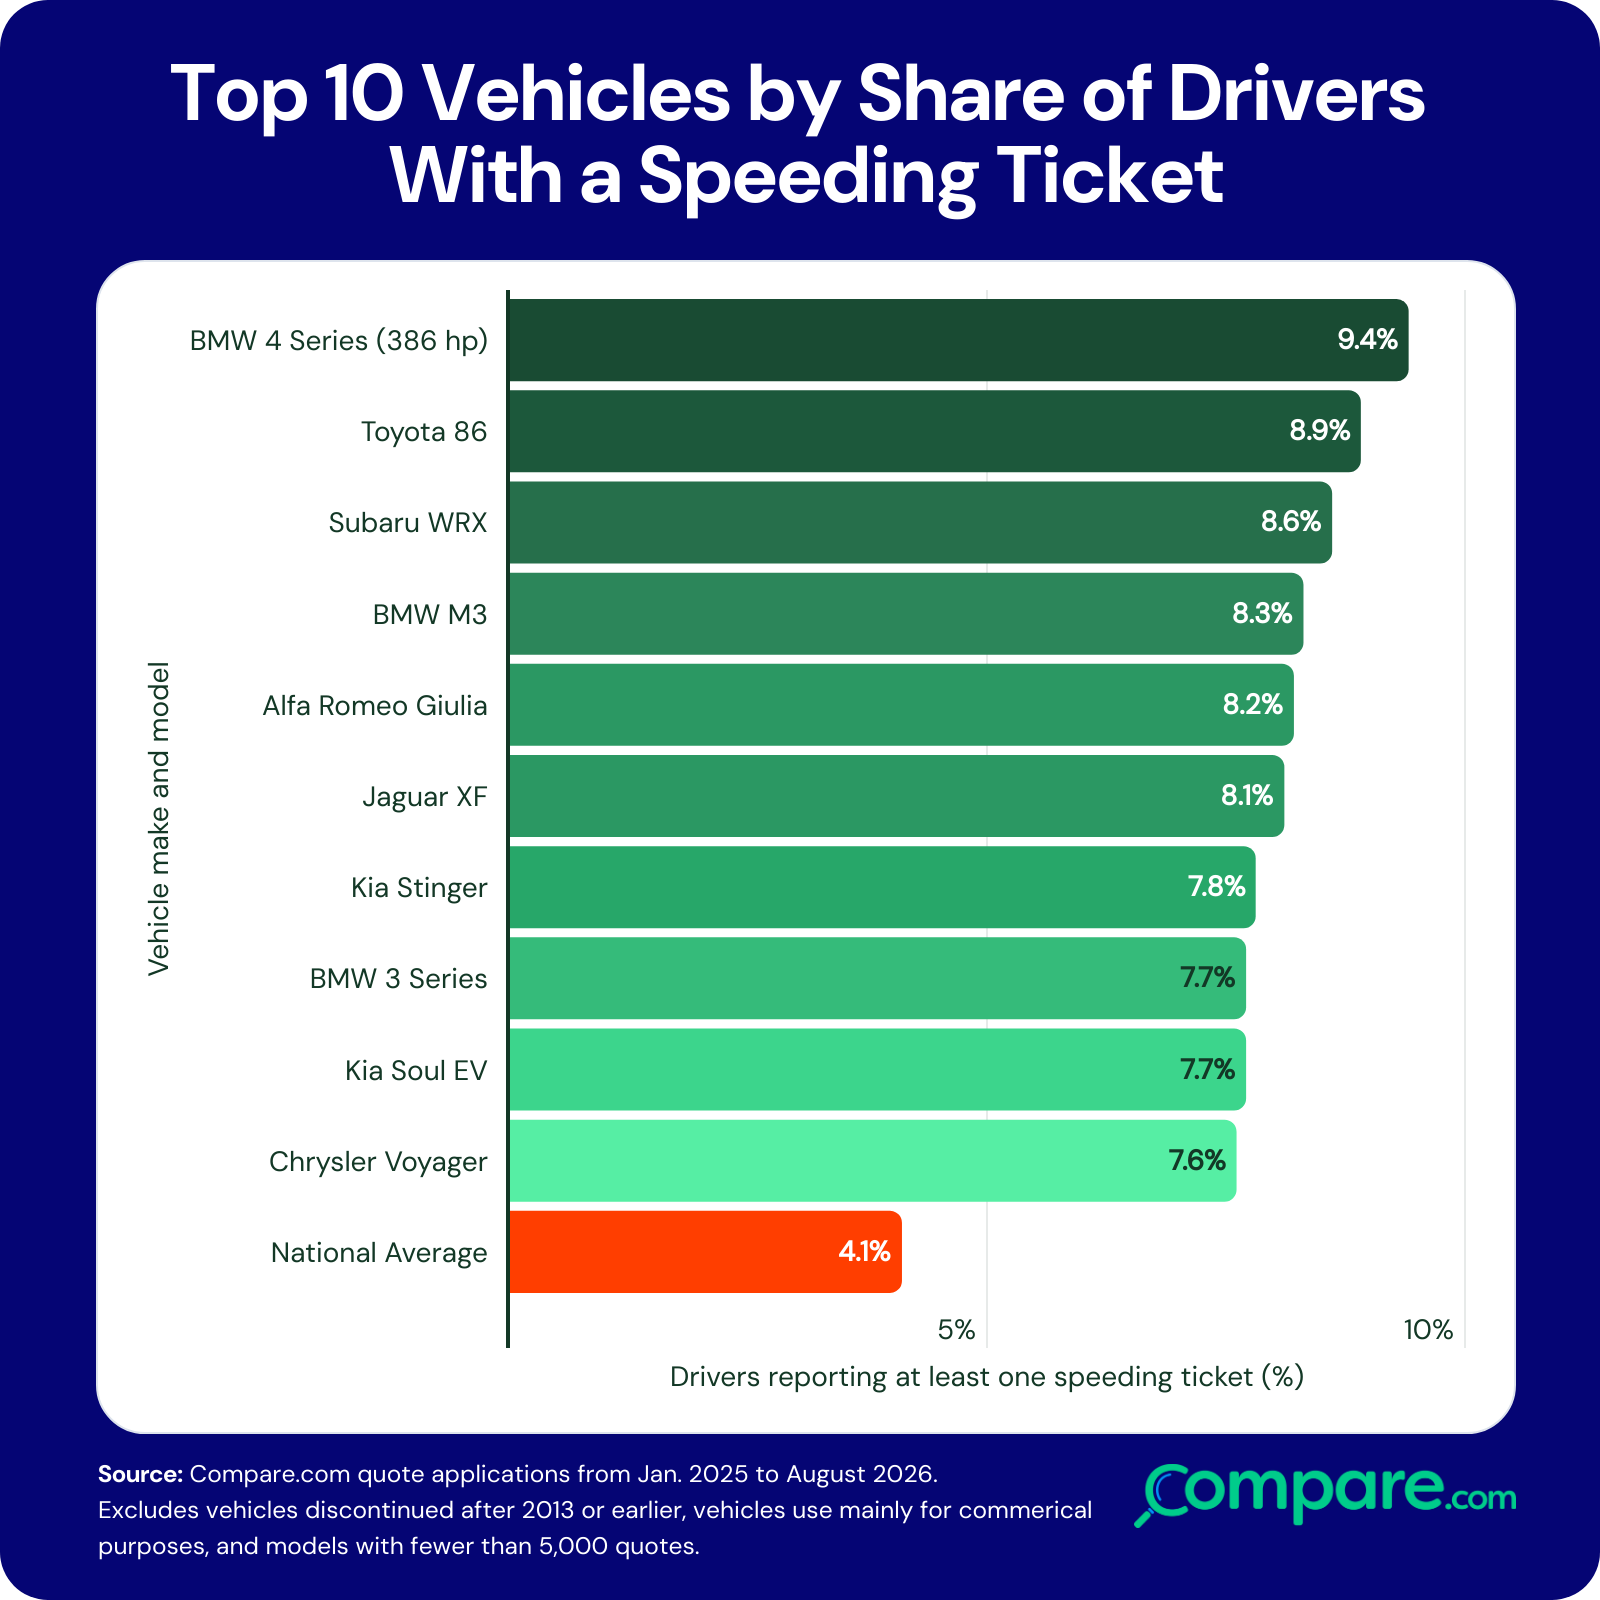
The BMW 4 Series has the highest speeding ticket rate in our analysis, at 9.4%, more than twice the national rate. Even with clean driving records, 4 Series drivers pay 43% more than the average driver for car insurance, and premiums reach $359 per month after a speeding ticket.
With 255–386 horsepower across the lineup, the 4 Series reaches 0 to 60 mph in about 4.2 to 5.8 seconds, depending on configuration. The turbocharged engine of the BMW 4 Series delivers peak torque at relatively low RPMs. That quick buildup of speed could make it easier for drivers to misjudge acceleration, and it may be why the 4 Series also leads our analysis of cars with the highest accident rate.
2. Toyota 86
Drivers with a speeding ticket: 89 in 1,000 drivers
Average annual premium post-speeding ticket: $3,609 (+10%)
Base horsepower: 205 (manual)
MSRP: under $27,000
The Toyota 86 proves drivers don’t need a big budget or a turbocharger to collect speeding tickets. Its 2.0-liter manual transmission has 205 horsepower and reaches 0 to 60 mph in 6.2 seconds. Even so, drivers of the 86 are 117% more likely to have a speeding ticket on their record (8.9%).
Though not the fastest car on the list, the Toyota 86 pairs affordability with rear-wheel drive, a lightweight chassis, and responsive steering, which may attract drivers who favor spirited driving.
A speeding ticket raises the 86’s average full-coverage premium by 10%. This puts the monthly insurance payments at $301.
3. Subaru WRX
Drivers with a speeding ticket: 86 in 1,000 drivers
Average annual premium post-speeding ticket: $3,358 (+21%)
Base horsepower: 271
MSRP: $35,750
Subaru marketed the WRX as a rally-inspired sedan, which may appeal to drivers looking for a more performance-focused driving experience. The base model’s 2.4-liter turbocharged BOXER four-cylinder engine produces 271 horsepower and reaches 0 to 60 mph in 5.5 seconds. More than 1 in 12 WRX drivers (8.6%) report a speeding ticket.
After a ticket, they pay an average of $280 per month for car insurance.
4. BMW M3
Drivers with a speeding ticket: 83 in 1,000 drivers
Average annual premium post-speeding ticket: $4,162 (+13%)
Base horsepower: 473
MSRP: $78,400
The quickest and most expensive car on the list, the BMW M3 has a ticket rate of 8.3%, about 1 in 12 drivers. Its 3.0-liter twin-turbocharged six-cylinder engine produces 473 horsepower, more than any other vehicle on the list. The M3 base model reaches 0 to 60 mph in 4.1 seconds and tops out at 155 mph. That power allows rapid acceleration even when passing or merging, a situation that usually calls for caution.
After a ticket, drivers see an average insurance increase of 13%, one of the smallest increases on our list.
5. Alfa Romeo Giulia
Drivers with a speeding ticket: 82 in 1,000 drivers
Average annual premium post-speeding ticket: $4,273 (+19%)
Base horsepower: 280
MSRP: $48,245
The Alfa Romeo Giulia, the only Italian car on our list, has the second-highest post-ticket insurance rate, at $356 per month, just below the BMW 4 Series. The Giulia has a ticket rate of 8.2%, twice as high as the national average.
The standard rear-wheel drive Giulia has a 2.0-liter turbocharged four-cylinder engine and reaches 0 to 60 mph in 5.5 seconds. The practicality, used-car pricing, and sports-car feel of the Giulia create an accessible everyday vehicle whose performance appeal may help explain its speeding ticket rate.
6. Jaguar XF
Drivers with a speeding ticket: 81 in 1,000 drivers
Average annual premium post-speeding ticket: $4,265 (+45%)
Base horsepower: 246
MSRP: $49,800
The British-made Jaguar XF has an 8.1% ticket rate even though it’s the slowest sports sedan in our top 10, edging out only an EV and a minivan in acceleration. Its rear-wheel base version pairs a 2.0-liter turbocharged four-cylinder engine with a 6.5-second 0-to-60-mph time.
A speeding ticket affects XF drivers’ insurance rates more than any other in the top 10, raising the average premium by 45%. Jaguar ended XF production in June 2024, and this model has no direct replacement. Its British engineering often requires a specialty mechanic, meaning owners could face higher insurance premiums and rising repair costs as parts get harder to find.
7. Kia Stinger
Drivers with a speeding ticket: 78 in 1,000 drivers
Average annual premium post-speeding ticket: $4,044 (+24%)
Base horsepower: 300
MSRP: $36,590
About 1 in 13 Kia Stinger drivers (7.8%) report having a recent speeding ticket, and these drivers experience an average premium increase of 24%.
The base Stinger tops out at 130 mph with a 2.5-liter turbocharged engine and hits 0 to 60 mph in 5.2 seconds. Higher trim levels with a 3.3-liter twin turbo can reach 167 mph. With a price point below many luxury sports sedans, the sporty fastback Kia Stinger brought high performance outside the traditional luxury market.
8. BMW 3 Series
Drivers with a speeding ticket: 77 in 1,000 drivers
Average annual premium post-speeding ticket: $3,705 (+30%)
Base horsepower: 255
MSRP: $45,500
The BMW 3 Series has a ticket rate of 7.7%, about 88% higher than average. Its base version, the 330i, comes standard with a 2.0-liter turbocharged engine and gearshift paddles, and it goes from 0 to 60 mph in 5.6 seconds. This combination gives drivers quick access to speed and more control over gear changes, which may encourage harder acceleration. After receiving a ticket, 3 Series drivers average a 30% increase in auto insurance rates, paying $309 per month.
9. Kia Soul EV
Drivers with a speeding ticket: 77 in 1,000 drivers
Average annual premium post-speeding ticket: $3,113 (+9%)
Base horsepower: 109
MSRP: $33,950
The Kia Soul EV is the only electric vehicle in the top 10. Our data shows 1 in 13 Soul EV drivers (7.7%) report having a recent speeding ticket, tying with the 3 Series.
The Soul EV takes 11.2 seconds to hit 60 mph, but its electric motor delivers immediate torque, giving drivers a responsive feel at lower speeds. Paired with its youthful styling and accessible price, the Soul EV may appeal to younger drivers with limited driving experience, which could help explain the vehicle’s high speeding ticket rate. Soul EV drivers see an average premium increase of 9%, the lowest increase of the 10.
10. Chrysler Voyager
Drivers with a speeding ticket: 76 out of 1,000
Average annual premium post-speeding ticket: $3,024 (+27%)
Base horsepower: 287
MSRP: $41,395
Similar to the Soul EV, the Chrysler Voyager isn’t particularly fast, and buyers are likely looking for value, not performance. Still, Voyager drivers are about 85% more likely to have a ticket (7.6%). The Voyager has a 3.6-liter V-6 engine without a turbocharger and reaches 0 to 60 mph in about 7.3 seconds.
The Voyager’s elevated ticket rate likely has less to do with a driver’s desire for a speedy car. The pressure of running behind or keeping up with traffic, as noted by the NHTSA, may be what’s driving the minivan’s higher ticket rate. Voyager drivers experience a rate increase of 27% after receiving one speeding ticket.
 Writer: Shannon MartinEconomic Analyst and Licensed Insurance Agent
 Editor: Nick VersawSenior Managing Editor